The dashboard answers “what do I need to handle today?” Reports answer “how is the business doing?” Between them you always know where you stand, and you can export the numbers when your accountant asks.
1 Start your day on the dashboard
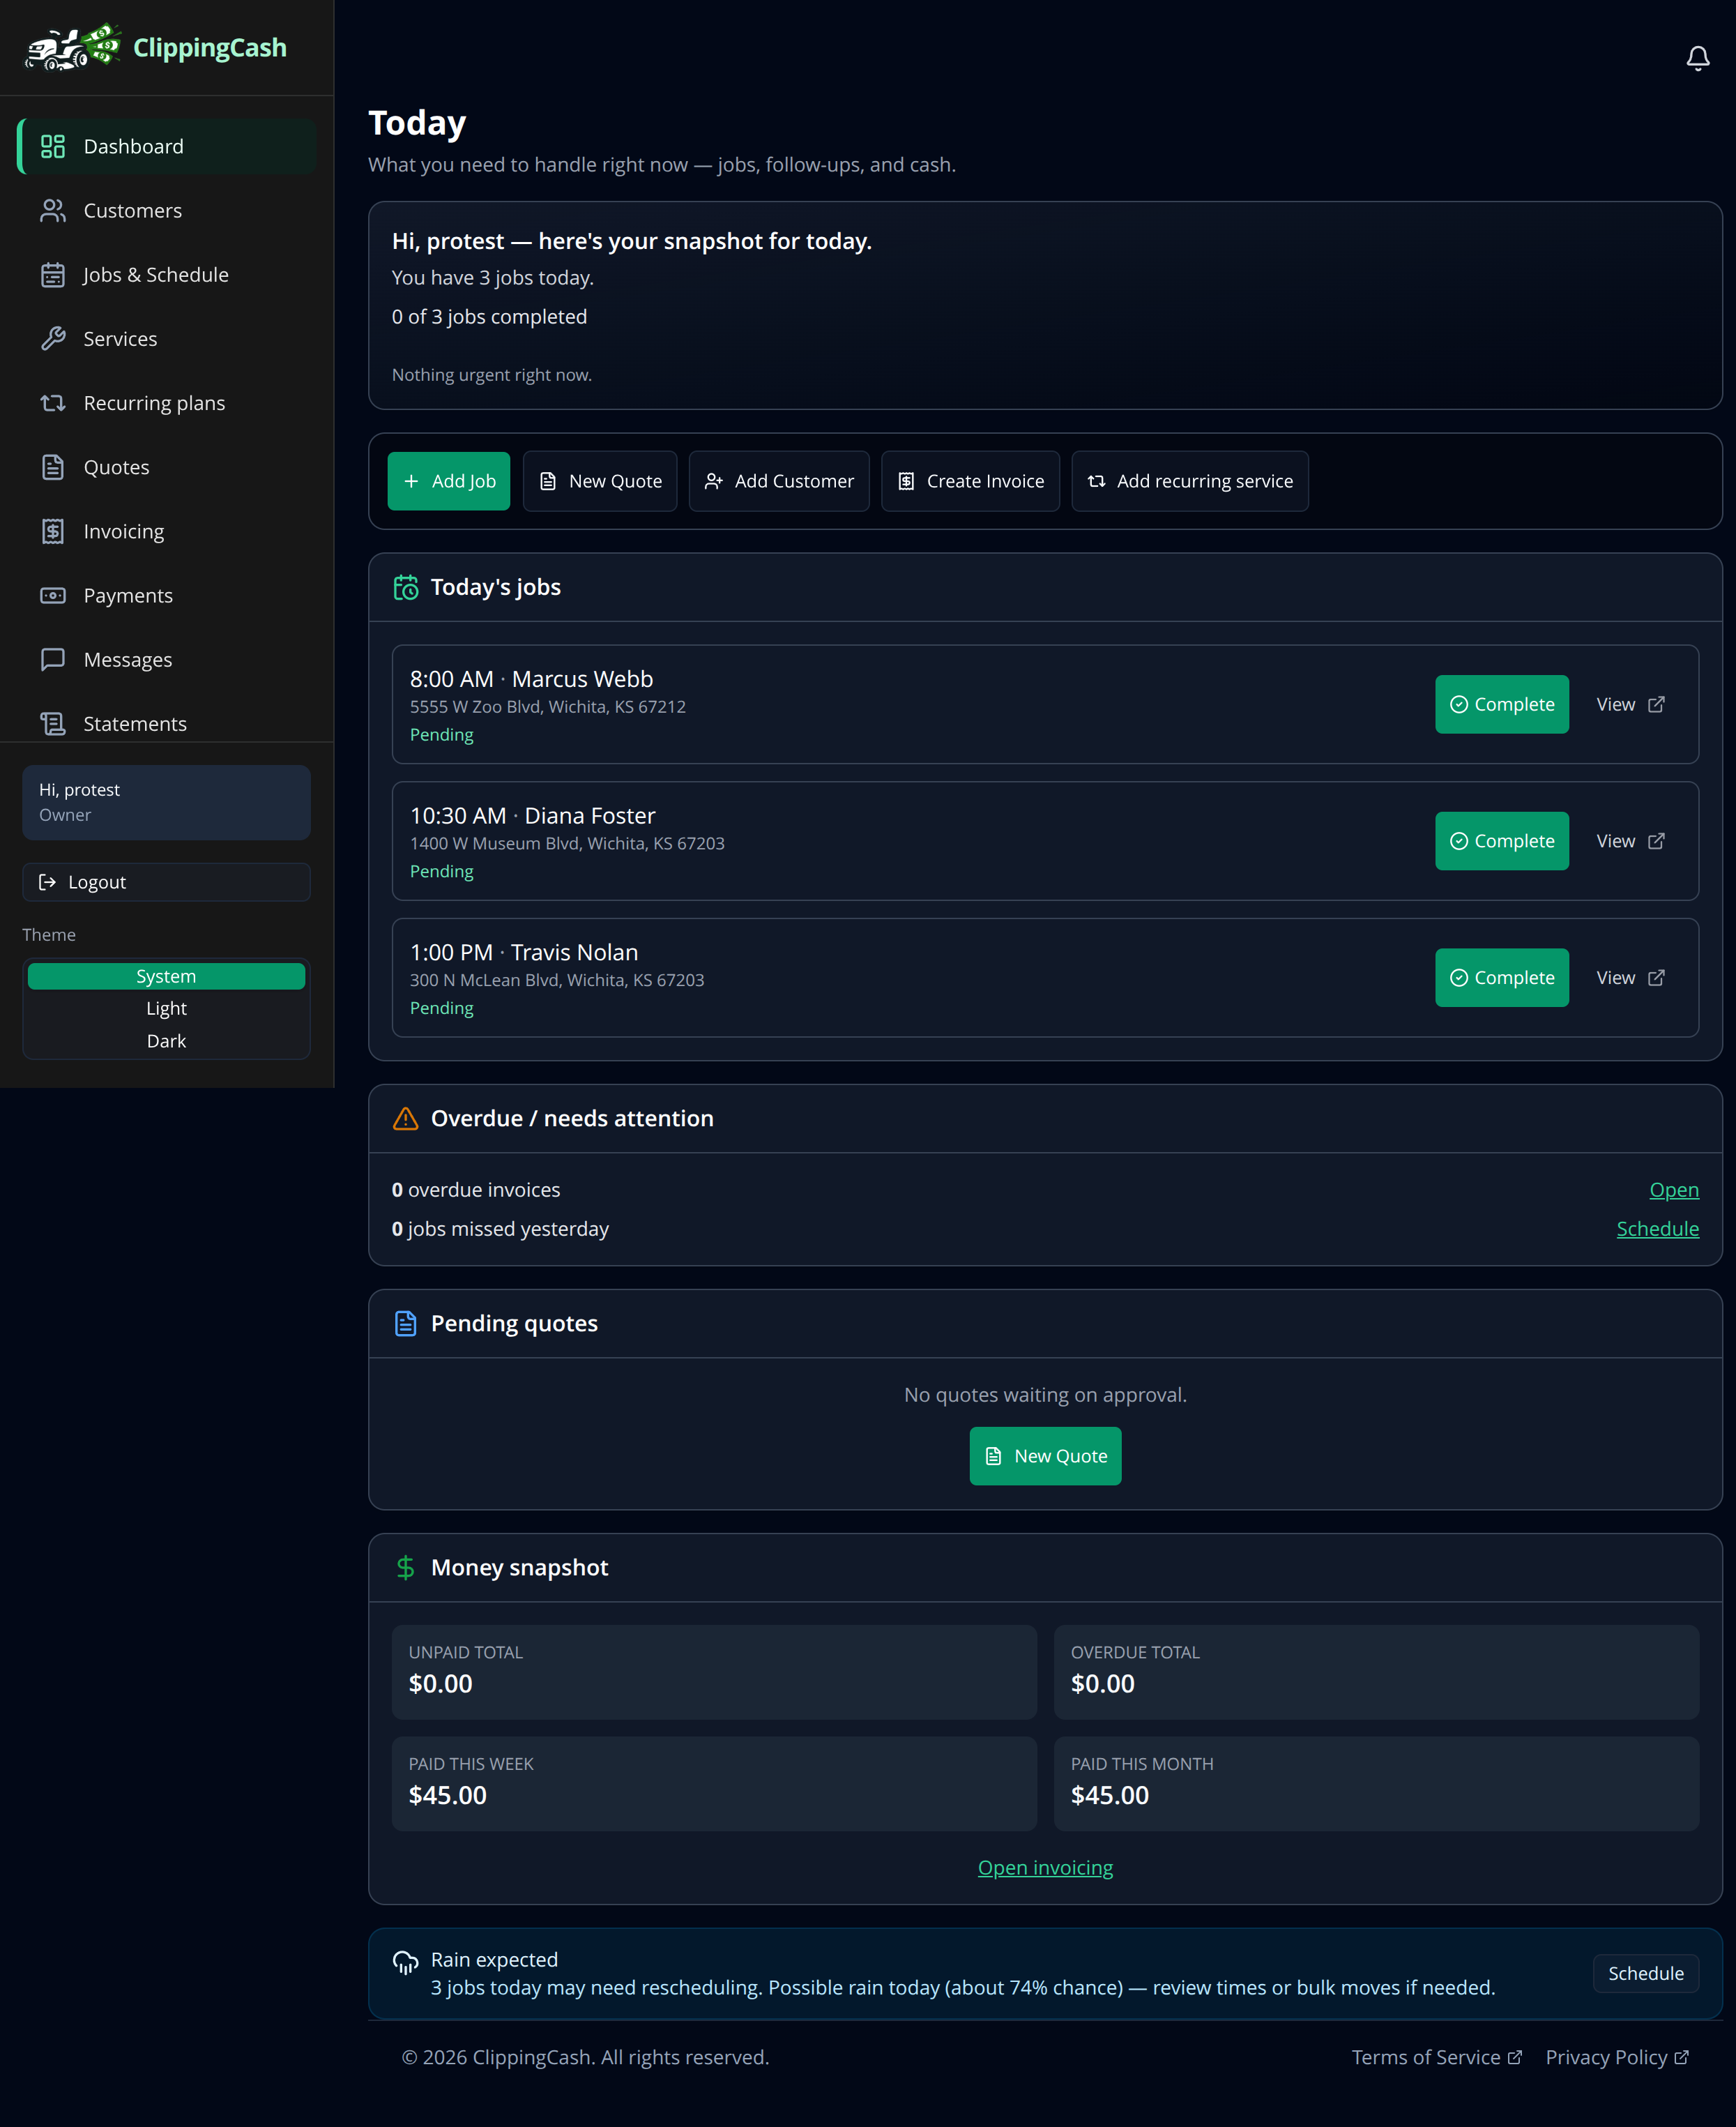
Open Dashboard for a snapshot of today: how many jobs you have, which ones are left, anything overdue, pending quotes, and a money snapshot of what you have collected this week and month. Quick action buttons up top let you add a job, quote, customer, or invoice in one click.
A 7-day forecast card shows each of the next seven days with its weather, high and low and chance of rain, and a day with a 60% chance of rain or more is tinted so it stands out. The forecast is for your shop address, or the middle of your pinned properties if no shop address is set; with neither, the card stays hidden. When the time clock is on, owners, admins, office staff and bookkeepers also get a Time clock card to clock in and out from the office.
2 Dig into reports
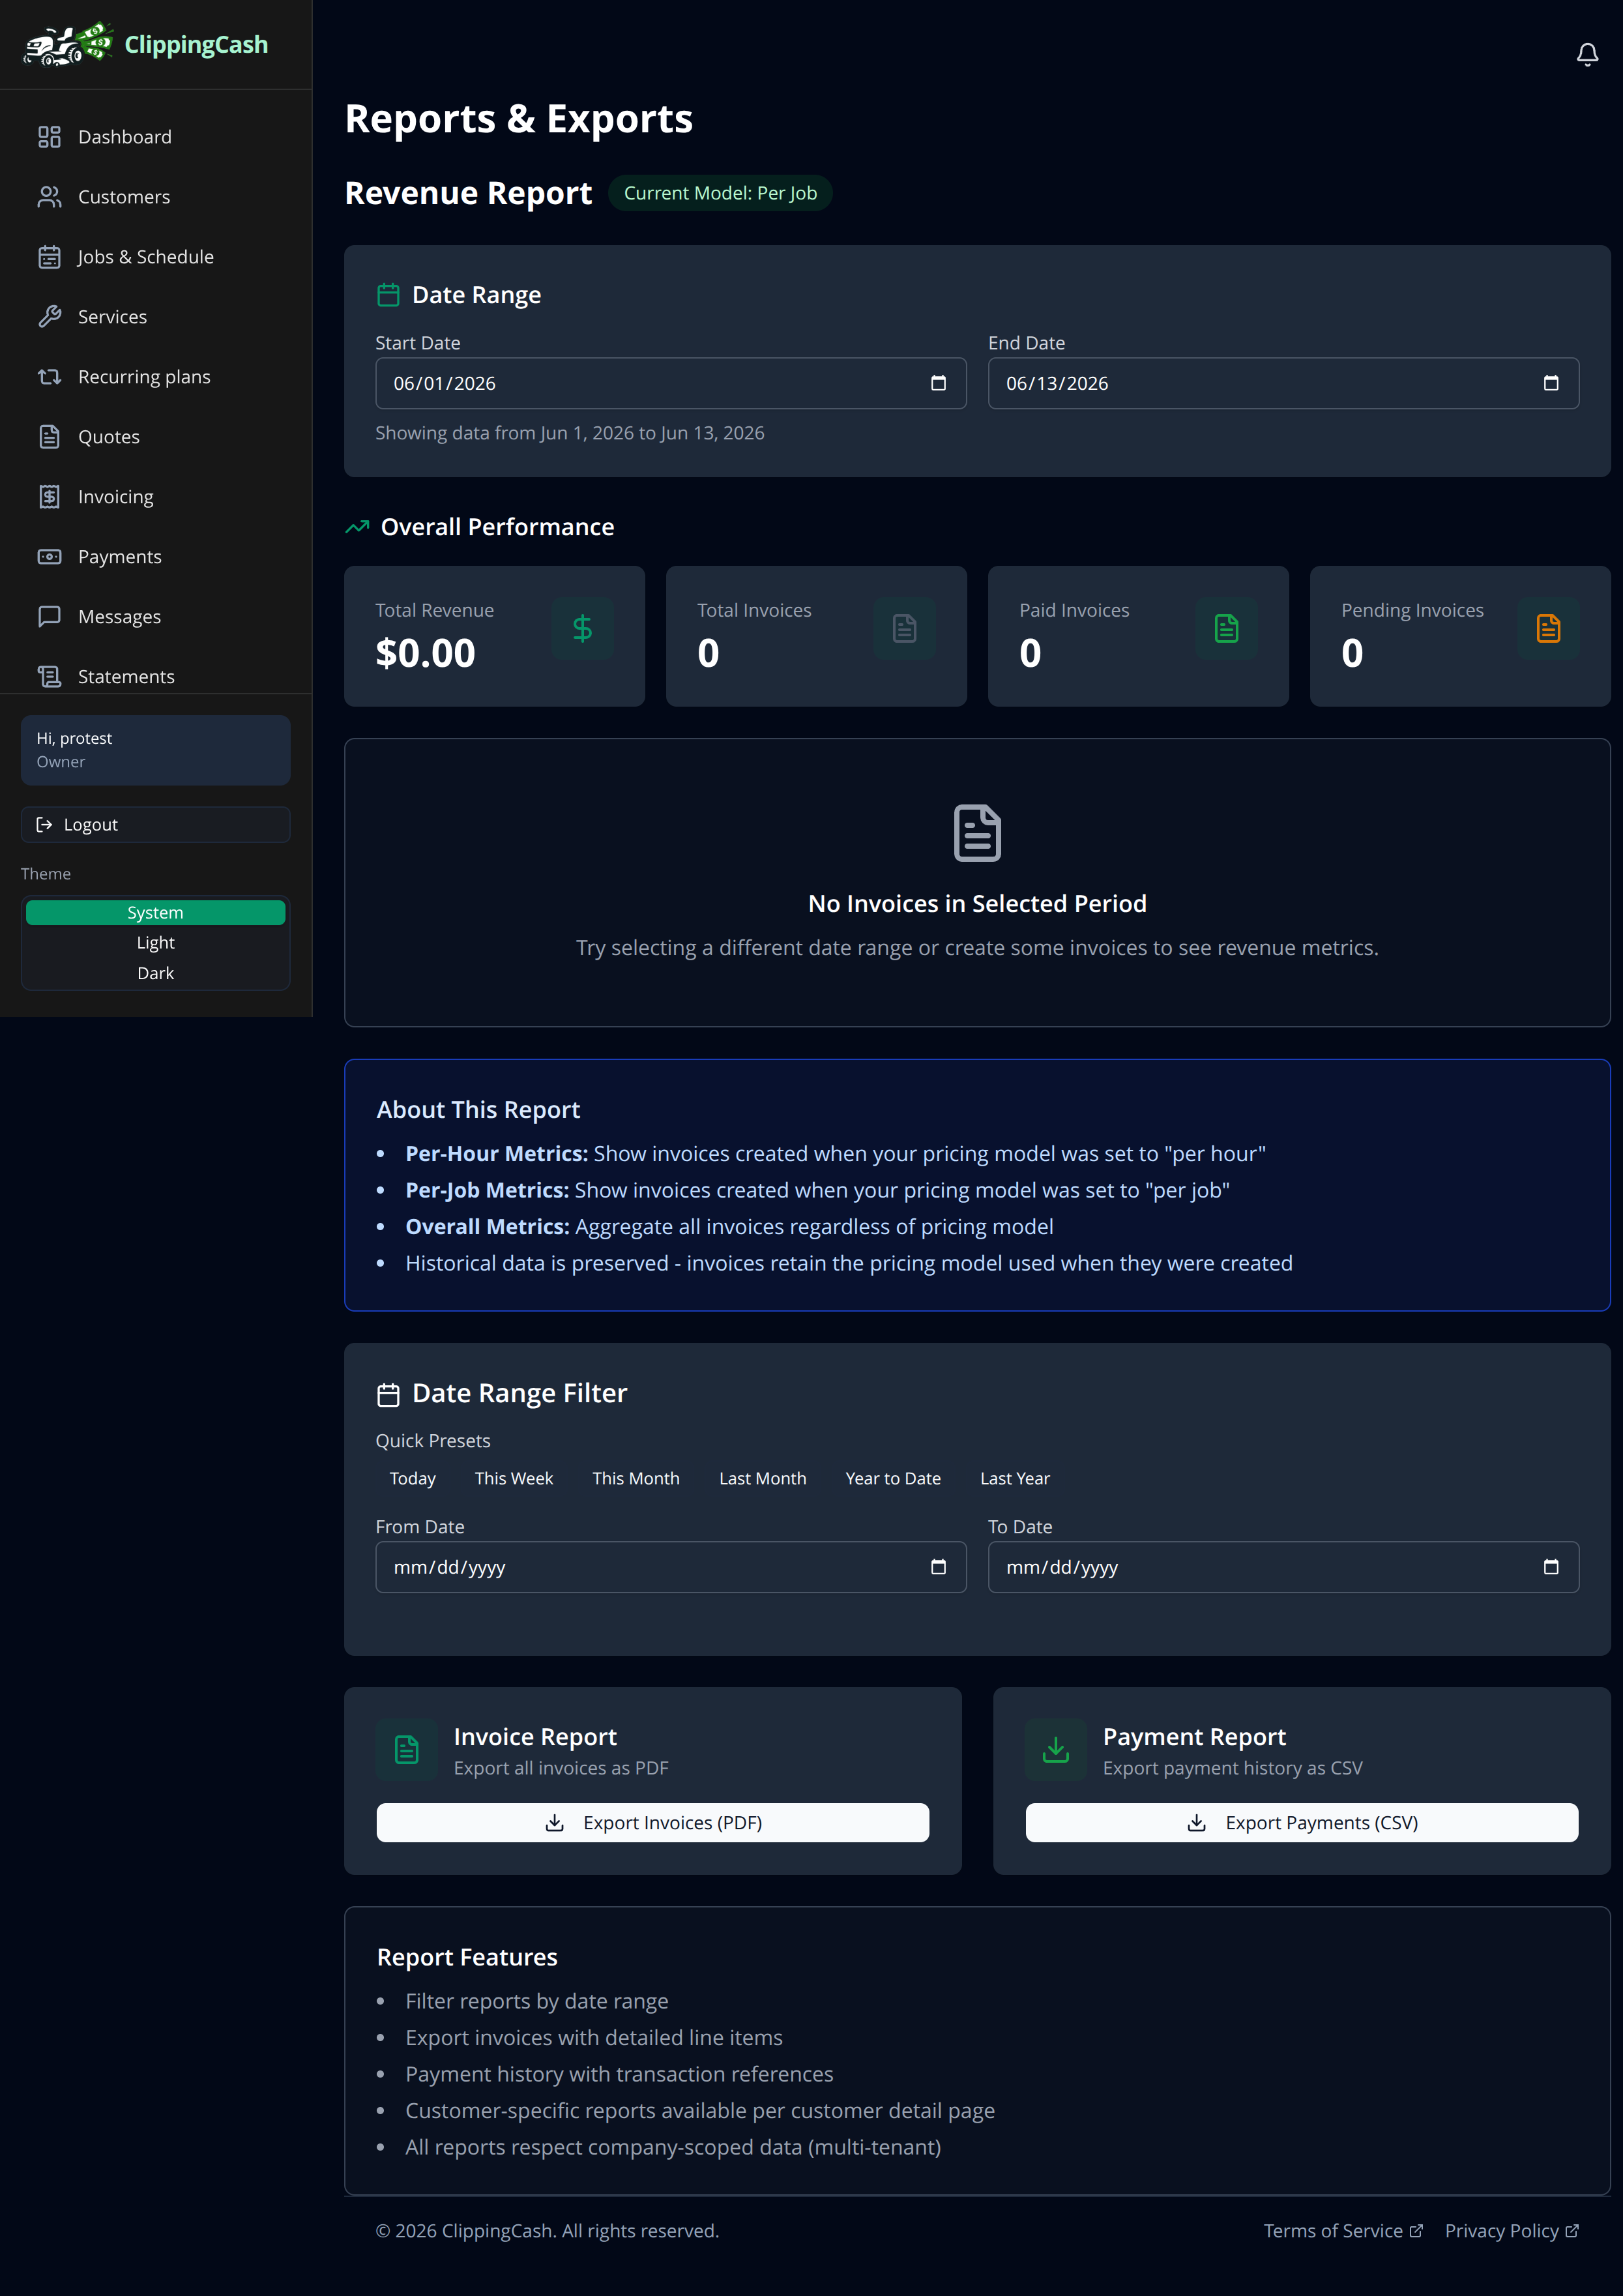
For the bigger picture, open Reports. Pick a date range to see total revenue, paid and pending invoices, and performance over time. Export your invoices to PDF or your payments to CSV whenever you need the records for taxes or your bookkeeper.
The payments CSV has Tip, Refunded and Net columns next to the amount, so you can see what a customer handed over, what you gave back and what you kept without doing the subtraction yourself. Revenue figures on Reports leave out sales tax and late fees. For the full season package, see the year-end tax package.
Further down, Customer referrals lists every customer who has referred someone, with each referral’s date and whether that customer has paid their first invoice. It covers all time, not the date range you picked. Referrals come from the Referred by field on a customer or a quote; see how to add a customer.